Explore the Ocean
What we know, how we know it, and what we have never seen.
The big picture
One ocean, mostly deep, mostly unseen.
71%
The ocean covers about 71 percent of Earth's surface and holds about 97 percent of its water.Source: NOAA (The Ocean, undated), The Ocean (undated)
Source undated · checked 18 October 2026
3,682 m
The average depth of the ocean is about 3,682 meters (12,080 feet), an estimate calculated in 2010 by NOAA and Woods Hole scientists using satellite measurements.Source: NOAA (How deep is the ocean?, undated), How deep is the ocean? (undated)Source: NOAA OE (How deep is the ocean?, undated), How deep is the ocean? (undated)
Source undated · checked 18 October 2026
≈ 11,000 m
The deepest known point, Challenger Deep in the Mariana Trench, is nearly 11,000 meters down; NOAA gives about 10,935 meters (35,876 feet).Source: NOAA (How deep is the ocean?, undated), How deep is the ocean? (undated)
Source undated · checked 18 October 2026
28.7%
As of April 2026, 28.7 percent of the global seafloor had been mapped in high resolution with modern sonar.Source: Seabed 2030 (Global seabed mapping reaches new milestone as five million square kilometres added in a year, 20 April 2026), Global seabed mapping reaches new milestone as five million square kilometres added in a year (20 April 2026)Source: NOAA (How much of the ocean has been explored?, April 2026), How much of the ocean has been explored? (April 2026)
As of 20 April 2026
< 0.001%
People have directly seen, with cameras, robots or crewed submersibles, less than 0.001 percent of the deep seafloor, an area roughly the size of Rhode Island.Source: NOAA (How much of the ocean has been explored?, April 2026), How much of the ocean has been explored? (April 2026)Source: Bell et al. 2025 (How little we've seen: A visual coverage estimate of the deep seafloor, 7 May 2025), How little we've seen: A visual coverage estimate of the deep seafloor (7 May 2025)
As of 2025–2026
≈ 250,000
About 250,000 marine species have been formally named and accepted; estimates of how many exist in total vary widely.Source: WoRMS (250,000 accepted marine species, 13 May 2026), 250,000 accepted marine species (13 May 2026)
As of 13 May 2026
Interactive preview
Light fades. Pressure climbs.
The ocean is divided into zones by depth and light. Pick any depth to see where you are.
200 m(656 ft)
- Zone
- Twilight zone
- Faint blue light, too dim for photosynthesis.
- Pressure (approximate)
- About 21 atmospheres
- Roughly one more atmosphere for every 10 meters of seawater, on top of the one atmosphere of air at the surface.
- Average ocean depth: about 3,682 m
- Challenger Deep, the deepest known point: ≈ 11,000 m
Zone boundaries follow NOAA and are conventions, not sharp lines.Source: NOAA 1 (Layers of the Ocean, undated), Layers of the Ocean (undated)Source: NOAA 2 (How deep is the ocean?, undated), How deep is the ocean? (undated)Source: NOAA 3 (How does pressure change with ocean depth?, undated), How does pressure change with ocean depth? (undated)
Measured, predicted, filled in, seen
How do we know how deep it is?
A seafloor map looks complete, but it is usually stitched together from very different kinds of information. Try each one.
Illustrative schematic · Not real data
Satellites measure tiny bumps in the sea surface caused by the pull of large seafloor features, and depth is predicted from them. It covers the whole ocean, but coarsely: smaller features vanish and big ones can be the wrong height.Source: NOAA (Seafloor Mapping (explainer), undated), Seafloor Mapping (explainer) (undated)Source: NOAA OE (Seamount in the Jarvis Unit, PRIMNM (EX1705 background image), 2017), Seamount in the Jarvis Unit, PRIMNM (EX1705 background image) (2017)
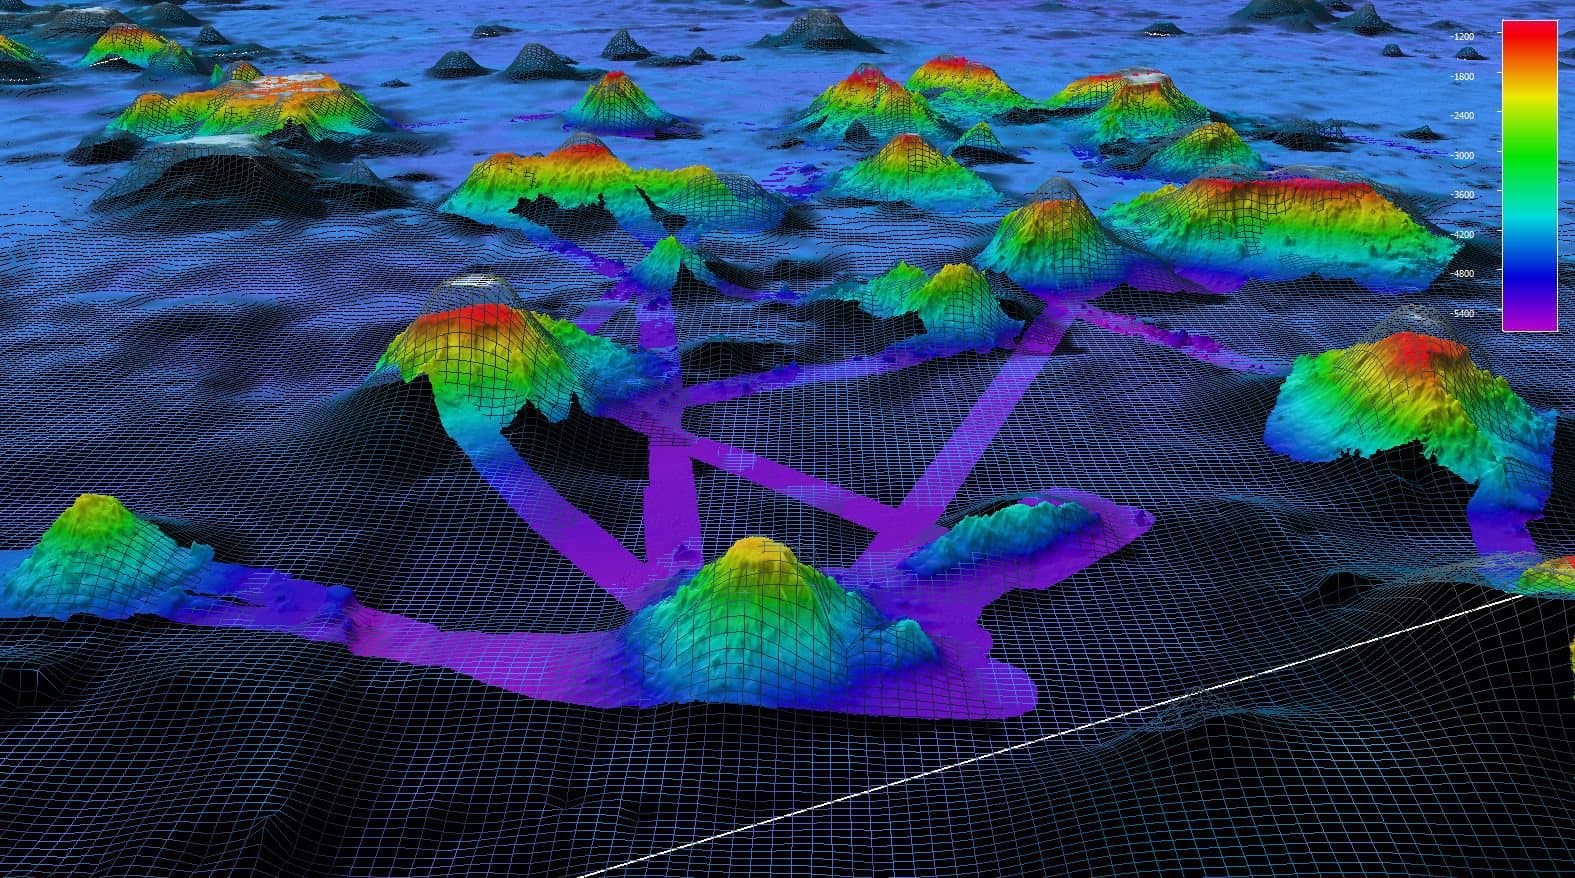
Satellite-derived maps cover the whole seafloor, but only coarsely: NOAA gives their resolution as about 1.5 kilometers (about a mile), so smaller features such as volcanic craters and shipwrecks can be missed.Source: NOAA (Seafloor Mapping (explainer), undated), Seafloor Mapping (explainer) (undated)
On a 2017 NOAA survey in the Pacific Remote Islands Marine National Monument, sonar found a seamount whose height differed by about 1,700 meters from what satellite data had predicted.Source: NOAA OE (Seamount in the Jarvis Unit, PRIMNM (EX1705 background image), 2017), Seamount in the Jarvis Unit, PRIMNM (EX1705 background image) (2017)
Global grids such as GEBCO record, cell by cell, what each depth is based on: for example, a direct measurement, a prediction from satellite gravity, or computer interpolation.Source: GEBCO (GEBCO Type Identifier (TID) Grid, undated), GEBCO Type Identifier (TID) Grid (undated)
Ocean and climate
The ocean is doing a lot of work.
91%
Ocean warming accounted for 91 percent of the heating in the climate system between 1971 and 2018.Source: IPCC (AR6 Working Group I, Summary for Policymakers, 2021), AR6 Working Group I, Summary for Policymakers (2021)
As of 2021
≈ 29%
Over 2015–2024 the ocean absorbed about 29 percent of the carbon dioxide released by human activities.Source: GCB 2025 (The Global Carbon Budget FAQs 2025, November 2025), The Global Carbon Budget FAQs 2025 (November 2025)
As of November 2025
−0.1 pH
Average surface-ocean pH has dropped by about 0.1 units since the Industrial Revolution, about a 30 percent increase in acidity. Seawater is still basic, not acidic.Source: NOAA (A primer on pH, undated), A primer on pH (undated)
Source undated · checked 18 October 2026
≥ 50%
The ocean produces at least half of Earth's oxygen, and marine life uses roughly the same amount.Source: NOAA (How much oxygen comes from the ocean?, undated), How much oxygen comes from the ocean? (undated)
Source undated · checked 18 October 2026
Life without sunlight
Discoveries that changed biology.
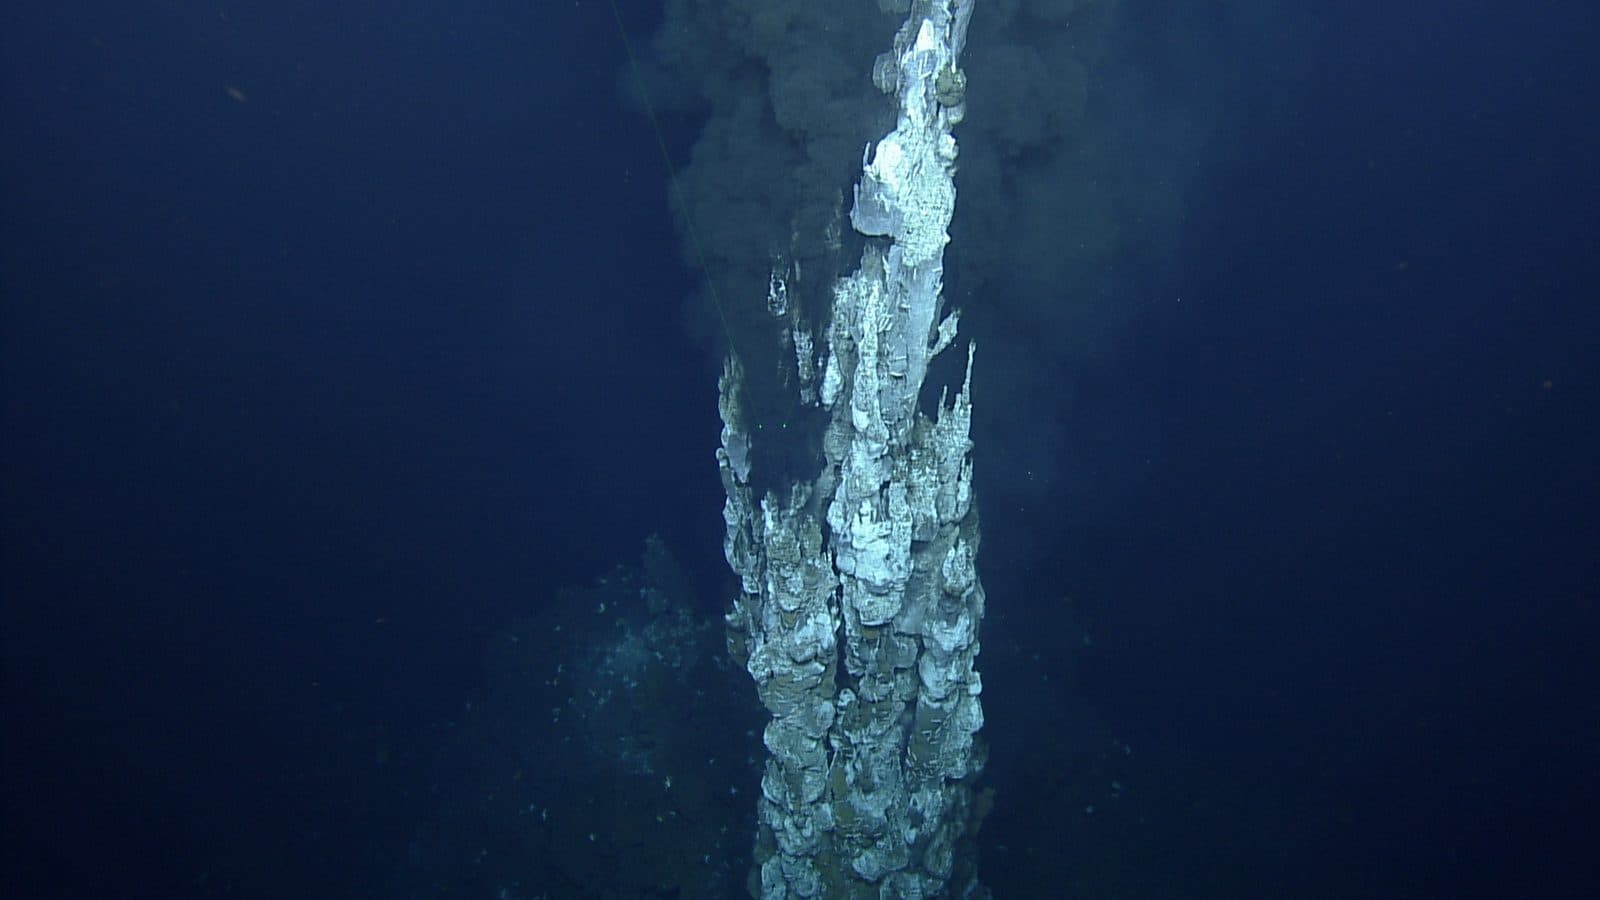
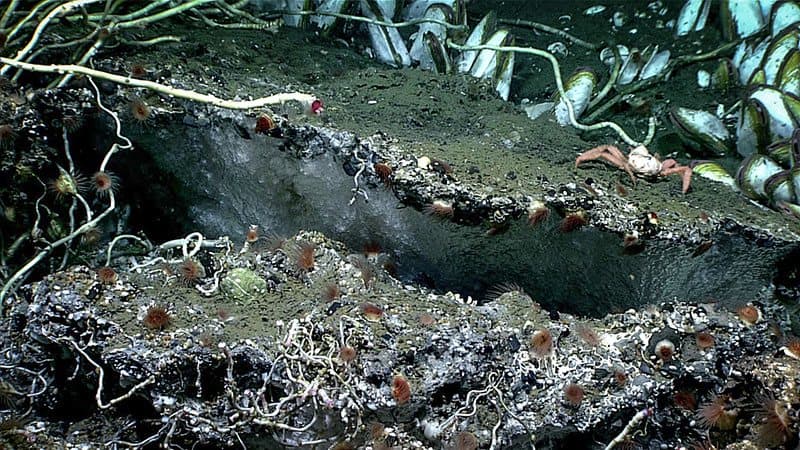
In 1977 scientists diving in the submersible Alvin on the Galápagos Rift, in the eastern Pacific, found springs of warm water on the seafloor surrounded by communities of animals living without sunlight.Source: WHOI (The Discovery of Hydrothermal Vents: 1977, undated), The Discovery of Hydrothermal Vents: 1977 (undated)
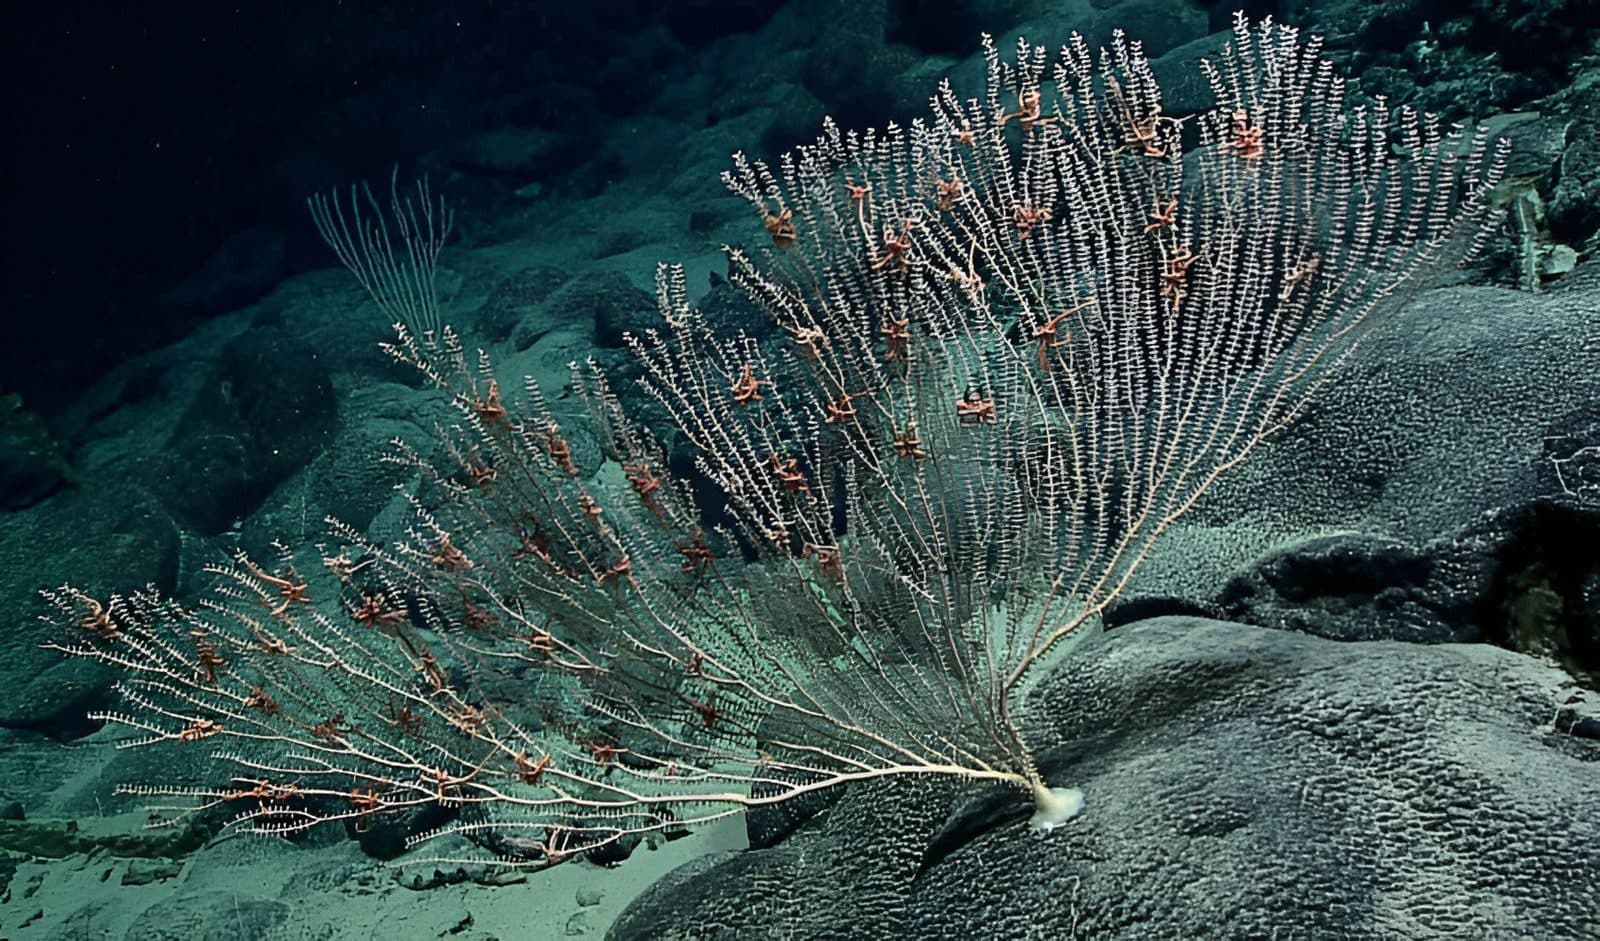
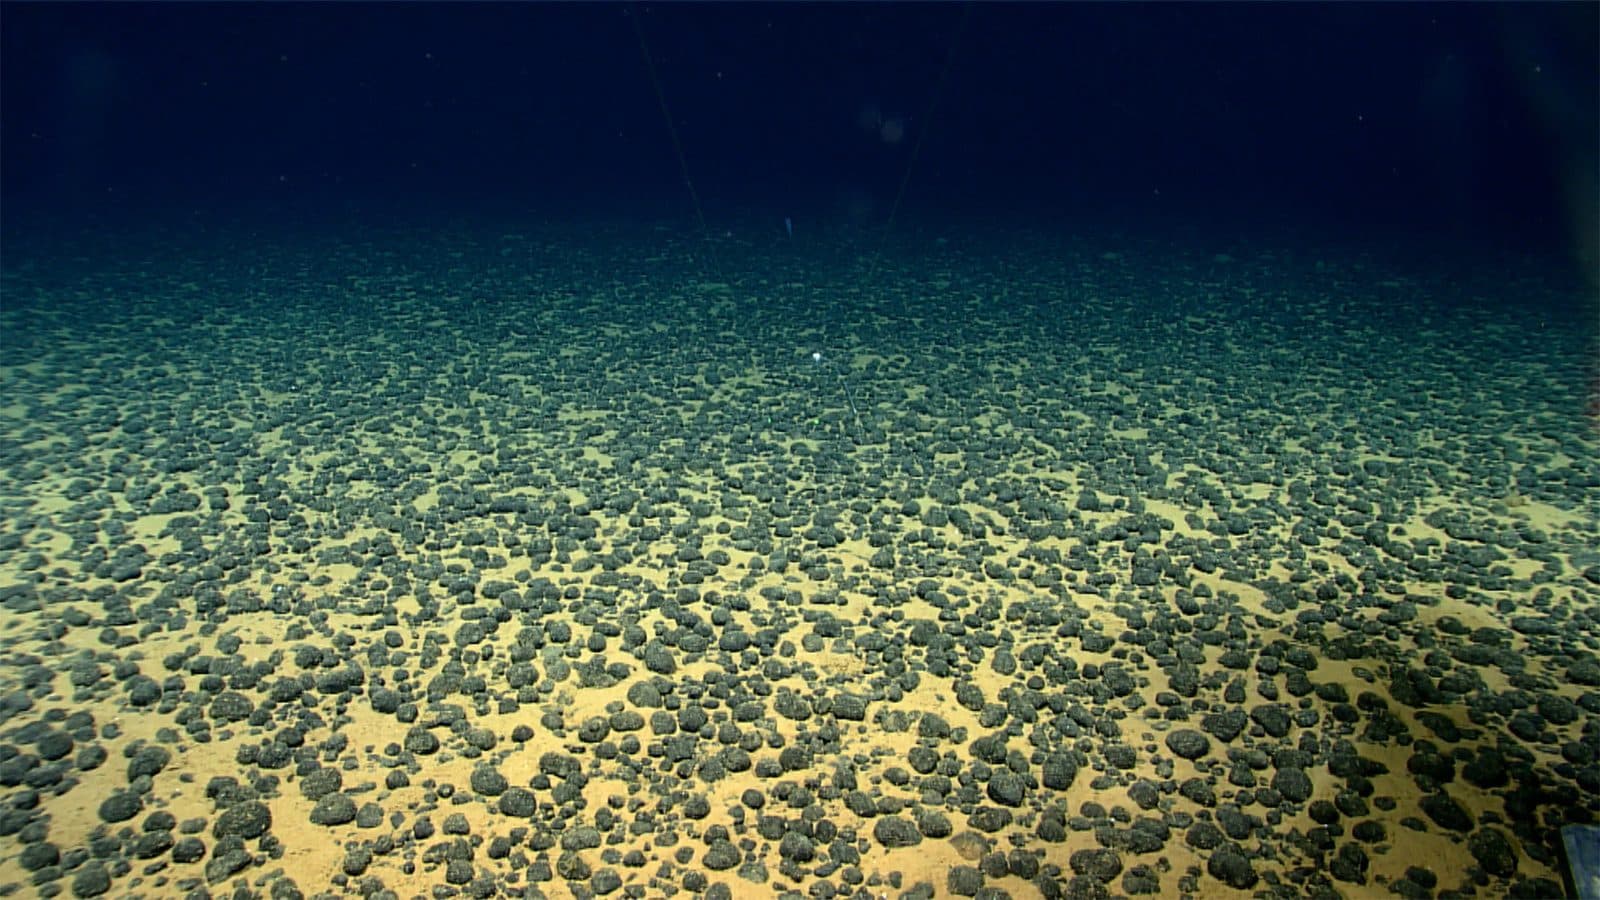
These NOAA photographs show deep-sea coral, methane hydrate and mineral nodules. Each caption follows NOAA's own identification; nothing is invented.
River to ocean
From Bethlehem to the Atlantic.
The watershed outside the door would be the starting point. Follow the water.
- PoconosLehigh River headwaters
- BethlehemMonocacy Creek meets the Lehigh
- EastonThe Lehigh joins the Delaware
- TrentonHead of tide: the estuary begins
- PhiladelphiaTidal river and port
- Delaware BayFresh and salt water mix
- Atlantic OceanBetween Cape May and Cape Henlopen
- 103 mi
- The Lehigh River runs about 103 miles from the Poconos to Easton, where it joins the Delaware River.Source: PA DCNR (Lehigh Gorge State Park (Lehigh River, 103 miles to Easton), undated), Lehigh Gorge State Park (Lehigh River, 103 miles to Easton) (undated)
- Source undated · checked 18 October 2026
- 1,359 sq mi
- At the USGS gauge at Glendon, just above its mouth, the Lehigh drains about 1,359 square miles.Source: USGS (Water-data report, station 01454700, Lehigh River at Glendon, PA, Water Year 1999), Water-data report, station 01454700, Lehigh River at Glendon, PA (Water Year 1999)
- As of Water Year 1999
- 13,539 sq mi
- The Delaware River Basin covers 13,539 square miles across Pennsylvania, New Jersey, New York and Delaware.Source: DRBC (2008 Annual Report (basin area by state), 2008), 2008 Annual Report (basin area by state) (2008)
- As of 2008
- 14.2 million
- About 14.2 million people rely on water from the Delaware River Basin.Source: DRBC (Delaware River Basin population update, 8 February 2023), Delaware River Basin population update (8 February 2023)
- As of 2020 data (published 2023)
Diagram, not a map; stops are in order but not to scale. Estuary extent (Trenton to the bay mouth):Source: PDE (About Us, undated), About Us (undated)
Ocean worlds
Oceans beyond Earth?
Several moons may hide oceans under ice. The careful word is “may”: these oceans are inferred, not seen, and no life has been found.
Europa (Jupiter)
Evidence suggests an ocean beneath the ice. NASA's Europa Clipper, launched in October 2024, is scheduled to reach Jupiter orbit in April 2030.Source: NASA (Europa Clipper mission timeline, undated), Europa Clipper mission timeline (undated)
Ganymede (Jupiter)
Hubble observations of its auroras, reported in 2015, suggested an underground ocean. ESA's Juice completed an Earth flyby in September 2026 on its way to Jupiter, arriving in 2031.Source: NASA (NASA's Hubble observations suggest underground ocean on Jupiter's largest moon, 12 March 2015), NASA's Hubble observations suggest underground ocean on Jupiter's largest moon (12 March 2015)Source: ESA (Successful Earth flyby improves Juice's course to Jupiter, September 2026), Successful Earth flyby improves Juice's course to Jupiter (September 2026)
Enceladus (Saturn)
Cassini studied icy grains sprayed from the south pole; analysis found phosphates, a building block for life, that came from its ocean. No life has been detected.Source: NASA JPL (NASA Cassini data reveals building block for life in Enceladus' ocean, June 2023), NASA Cassini data reveals building block for life in Enceladus' ocean (June 2023)
Titan (Saturn)
Long thought to hide an ocean, but a 2025 study argued against a global one. The question is open. NASA's Dragonfly rotorcraft is being built for launch no earlier than July 2028.Source: Nature 2025 (Titan's strong tidal dissipation precludes a subsurface ocean, December 2025), Titan's strong tidal dissipation precludes a subsurface ocean (December 2025)Source: NASA (NASA's Dragonfly clears key tests as Titan rotorcraft takes shape, 9 July 2026), NASA's Dragonfly clears key tests as Titan rotorcraft takes shape (9 July 2026)